Country Profile

  • Capital: Accra
  • Currency: GHS-Ghanaian Cedi (1 USD = 15.89 GHS) (*as of 21-Nov-2024)
  • Main Language(s): English (official), Akan
  • Administration: Presidential Republic. The President is Chief of the State and Head of the Government.
pin

Geographic Location

map
  • Region: Sub-Saharan Africa
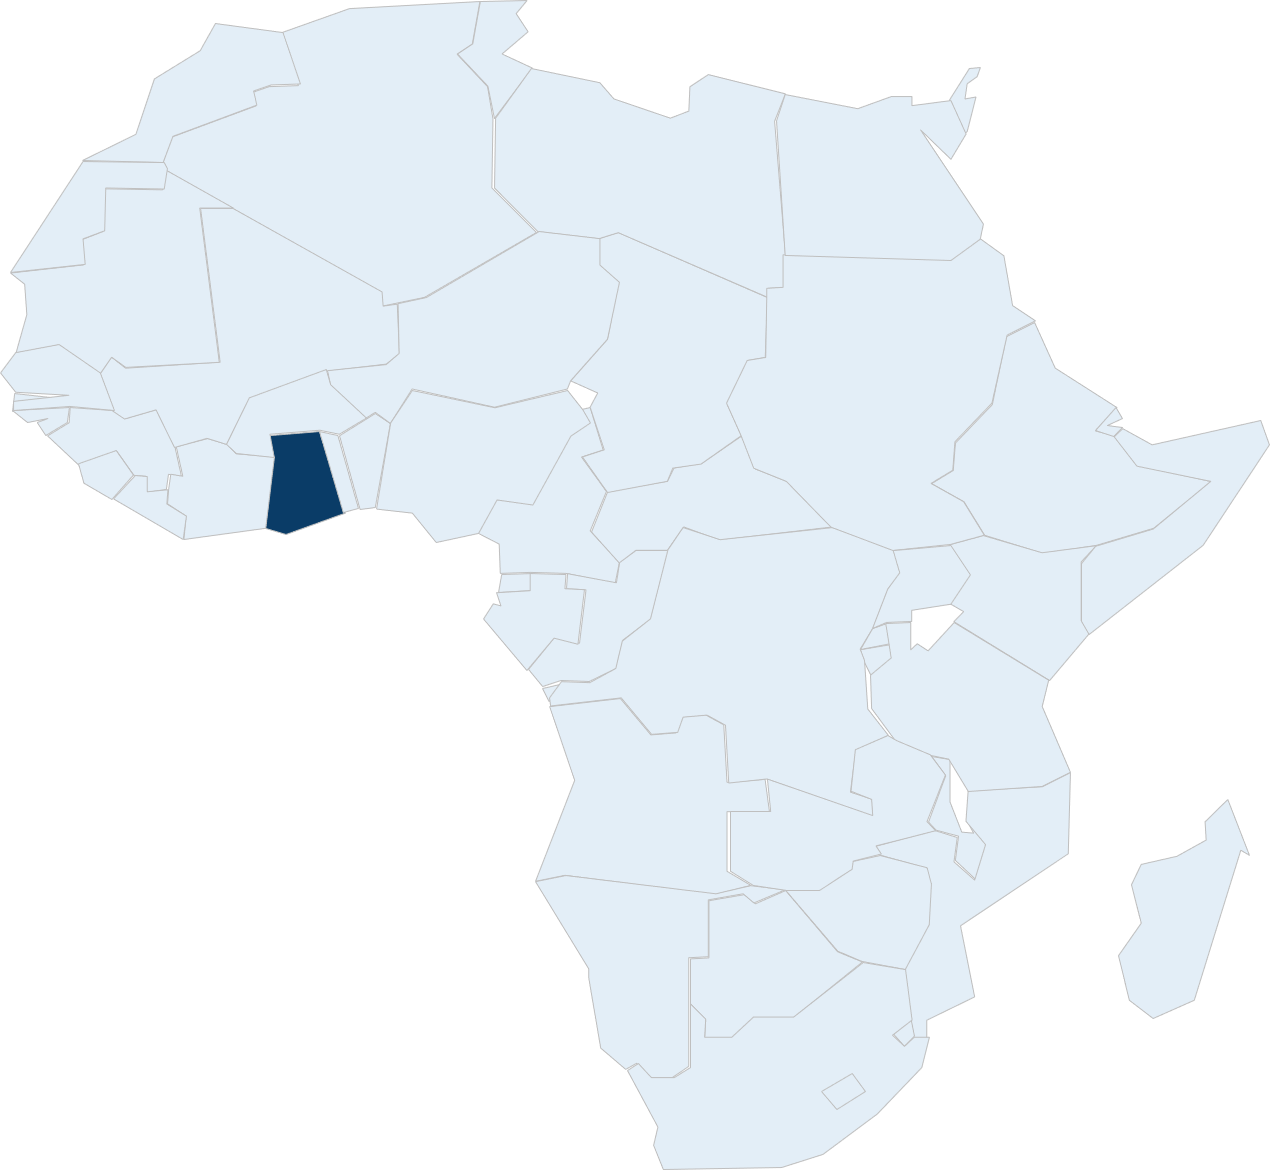
    Western Africa, bordering the Gulf of Guinea, between Cote d'Ivoire and Togo
Geographic Area - Total ('000 Sq. Km): 238.5
Time Zone: UTC+00:00
Accessibility (Hours):
New York 11
London, UK 7
Dubai 7
New Delhi 11
Frankfurt 9
pin

Macro Indicators (2020)

Population (Millions): 31.3
GDP (US$ Billions): 72.4
Annual GDP Growth (%): 0.4
Inflation Rate (Annual %): 14.9
Unemployment (%): 4.2 (2017)
Income Level: Lower Middle
ICT Service Exports (US$ Million): n/a
pin

Avasant Country Risk Profile

Very High Very Low
Overall Business Risk: Low
Political Risk: Low
Economic Risk: Stable
Service Disruption Risk: Low
Operations Scalability Risk (Human Resource): Low
pin

Global Business/ICT Rankings

Doing Business 2020 (190): 118
WEF Global Competitiveness 2019 (141): 111
WEF ICT Adoption 2019 (141): 90
Global Innovation Index 2021 (132): 112
support

Key ICT/Digital Providers

Domestic: GCNet, Mericom Solutions, Ostec
International: Airtel, Comsys, GCNet, Internet Solutions, IPMC, MTN, Redmango, Techno Brain, Vodafone
pin

Main Outsourcing/Digital Hubs

Accra, Tamale

Global Equations Digital Competitiveness Profile

radarview-image
  • Leader
  • Innovator
  • Challenger
  • Emerging

Digital Competitiveness Index™ classification and scores are derived by assessing 70+ parameters across five key digital competitiveness enabling pillars – Digital Ecosystem (30), Human Capital (25), Financial Attractiveness (25), Enabling Environment (15) and Supporting Infrastructure (5). Each segment indicates an overall aggregate score based on a range of sub indicators with varying degree of relevance to overall digital ecosystem and competitiveness.

Data Sources – The assessment is based on data from range of sources including publicly available third party sources e.g. World Bank, IMF as well as data collected directly by Avasant Global Equations and its partners – Computer Economics and Strativa Consulting.

For More Details on Data Sources and Assessment Methodology

Digital Competitiveness - Total Score: 37.49
37.49 100.00 Total Score : 37.49 Argentina: 63.86 Australia: 62.37 Austria: 63.84 Bahamas: 21.72 Barbados: 37.20 Belize: 26.94 Brazil: 64.40 Bulgaria: 64.10 Canada: 70.15 Chile: 67.18 China: 68.28 Colombia: 65.61 Costa Rica: 68.07 Croatia: 63.30 Czech Republic: 65.81 Denmark: 49.14 Dominican Republic: 56.19 Ecuador: 38.32 Egypt: 49.25 El Salvador: 50.09 Estonia: 71.15 Finland: 48.61 France: 63.90 Germany: 67.57 Ghana: 37.49 Grenada: 12.91 Guatemala: 50.34 Guyana: 21.82 Haiti: 33.53 Honduras: 50.55 Hungary: 66.46 Iceland: 47.97 India: 74.70 Indonesia: 43.69 Ireland: 70.18 Israel: 65.10 Jamaica: 52.28 Japan: 52.36 Jordan: 54.79 Kazakhstan: 42.86 Kenya: 38.51 Latvia: 66.11 Lithuania: 68.75 Malawi: 26.65 Malaysia: 73.81 Mauritius: 56.18 Mexico: 65.97 Morocco: 46.96 Netherlands: 66.67 New Zealand: 57.30 Norway: 47.47 Panama: 52.55 Peru: 35.97 Philippines: 63.04 Poland: 65.91 Portugal: 63.49 Qatar: 53.40 Romania: 65.21 Russia: 54.37 Rwanda: 31.95 Singapore: 65.32 Slovak Republic: 63.21 Slovenia: 63.02 South Africa: 55.82 South Korea: 52.93 Spain: 64.89 Sri Lanka: 59.92 St. Vincent And the Grenadines: 11.62 Sweden: 48.26 Switzerland: 52.45 Tanzania: 31.37 Thailand: 48.49 Trinidad And Tobago: 43.69 Turkey: 51.22 Ukraine: 52.35 United Arab Emirates: 66.79 United Kingdom: 69.64 United States: 71.52 Uruguay: 62.37 Vietnam: 47.76

SUB-PILLARS

Rating
Country Score

Digital Competitiveness Index™ classification and scores are derived by assessing 70+ parameters across five key digital competitiveness enabling pillars – Digital Ecosystem (30), Human Capital (25), Financial Attractiveness (25), Enabling Environment (15) and Supporting Infrastructure (5). Each segment indicates an overall aggregate score based on a range of sub indicators with varying degree of relevance to overall digital ecosystem and competitiveness.

Data Sources – The assessment is based on data from range of sources including publicly available third party sources e.g. World Bank, IMF as well as data collected directly by Avasant Global Equations and its partners – Computer Economics and Strativa Consulting.

For More Details on Data Sources and Assessment Methodology

Digital Services Ecosystem

5.83 30.00 Ghana: 5.83 Argentina: 19.03 Australia: 19.05 Austria: 18.80 Bahamas: 6.10 Barbados: 6.18 Belize: 6.97 Brazil: 20.02 Bulgaria: 18.47 Canada: 22.67 Chile: 20.44 China: 20.97 Colombia: 20.35 Costa Rica: 21.54 Croatia: 18.31 Czech Republic: 18.82 Denmark: 13.71 Dominican Republic: 14.72 Ecuador: 6.21 Egypt: 13.98 El Salvador: 11.43 Estonia: 21.91 Finland: 13.78 France: 21.36 Germany: 23.17 Grenada: 2.60 Guatemala: 12.48 Guyana: 3.34 Haiti: 4.92 Honduras: 10.79 Hungary: 19.75 Iceland: 13.29 India: 24.84 Indonesia: 7.66 Ireland: 23.34 Israel: 20.67 Jamaica: 12.41 Japan: 17.91 Jordan: 14.49 Kazakhstan: 9.97 Kenya: 6.98 Latvia: 18.03 Lithuania: 19.69 Malawi: 3.43 Malaysia: 22.53 Mauritius: 13.10 Mexico: 20.44 Morocco: 9.13 Netherlands: 22.06 New Zealand: 15.83 Norway: 13.74 Panama: 12.94 Peru: 6.16 Philippines: 15.66 Poland: 19.28 Portugal: 18.03 Qatar: 14.35 Romania: 18.47 Russia: 14.89 Rwanda: 4.93 Singapore: 20.65 Slovak Republic: 18.26 Slovenia: 16.72 South Africa: 14.13 South Korea: 19.20 Spain: 20.98 Sri Lanka: 15.46 St. Vincent And the Grenadines: 1.78 Sweden: 14.37 Switzerland: 16.18 Tanzania: 4.30 Thailand: 8.59 Trinidad And Tobago: 9.19 Turkey: 12.78 Ukraine: 13.51 United Arab Emirates: 20.21 United Kingdom: 22.73 United States: 25.34 Uruguay: 19.28 Vietnam: 10.03

Digital Competitiveness Index™ classification and scores are derived by assessing 70+ parameters across five key digital competitiveness enabling pillars – Digital Ecosystem (30), Human Capital (25), Financial Attractiveness (25), Enabling Environment (15) and Supporting Infrastructure (5). Each segment indicates an overall aggregate score based on a range of sub indicators with varying degree of relevance to overall digital ecosystem and competitiveness.

Data Sources – The assessment is based on data from range of sources including publicly available third party sources e.g. World Bank, IMF as well as data collected directly by Avasant Global Equations and its partners – Computer Economics and Strativa Consulting.

For More Details on Data Sources and Assessment Methodology

Business Environment

8.99 15.00 Ghana: 8.99 Argentina: 8.37 Australia: 11.08 Austria: 11.09 Bahamas: 2.91 Barbados: 8.45 Belize: 2.25 Brazil: 8.29 Bulgaria: 9.77 Canada: 11.49 Chile: 10.43 China: 10.42 Colombia: 8.82 Costa Rica: 8.91 Croatia: 9.14 Czech Republic: 10.31 Denmark: 11.66 Dominican Republic: 8.34 Ecuador: 8.07 Egypt: 9.03 El Salvador: 7.21 Estonia: 11.02 Finland: 12.07 France: 10.89 Germany: 11.38 Grenada: 2.70 Guatemala: 7.83 Guyana: 2.81 Haiti: 5.22 Honduras: 7.64 Hungary: 9.64 Iceland: 11.25 India: 9.96 Indonesia: 9.93 Ireland: 11.05 Israel: 11.30 Jamaica: 8.74 Japan: 11.10 Jordan: 10.08 Kazakhstan: 9.53 Kenya: 9.71 Latvia: 10.20 Lithuania: 10.48 Malawi: 8.06 Malaysia: 11.32 Mauritius: 10.41 Mexico: 8.64 Morocco: 9.95 Netherlands: 11.53 New Zealand: 11.89 Norway: 11.61 Panama: 9.29 Peru: 8.68 Philippines: 8.78 Poland: 9.65 Portugal: 10.28 Qatar: 10.22 Romania: 9.61 Russia: 8.87 Rwanda: 9.90 Singapore: 12.39 Slovak Republic: 9.76 Slovenia: 10.59 South Africa: 9.04 South Korea: 10.86 Spain: 10.50 Sri Lanka: 9.23 St. Vincent And the Grenadines: 2.88 Sweden: 11.61 Switzerland: 11.43 Tanzania: 8.46 Thailand: 10.16 Trinidad And Tobago: 8.06 Turkey: 9.50 Ukraine: 8.30 United Arab Emirates: 11.86 United Kingdom: 11.66 United States: 11.65 Uruguay: 9.01 Vietnam: 9.21

Digital Competitiveness Index™ classification and scores are derived by assessing 70+ parameters across five key digital competitiveness enabling pillars – Digital Ecosystem (30), Human Capital (25), Financial Attractiveness (25), Enabling Environment (15) and Supporting Infrastructure (5). Each segment indicates an overall aggregate score based on a range of sub indicators with varying degree of relevance to overall digital ecosystem and competitiveness.

Data Sources – The assessment is based on data from range of sources including publicly available third party sources e.g. World Bank, IMF as well as data collected directly by Avasant Global Equations and its partners – Computer Economics and Strativa Consulting.

For More Details on Data Sources and Assessment Methodology

Human Capital

9.50 25.00 Ghana: 9.50 Argentina: 16.19 Australia: 16.47 Austria: 18.10 Bahamas: 6.52 Barbados: 12.26 Belize: 9.61 Brazil: 15.01 Bulgaria: 14.62 Canada: 19.28 Chile: 16.77 China: 14.89 Colombia: 16.43 Costa Rica: 17.18 Croatia: 15.88 Czech Republic: 17.18 Denmark: 10.72 Dominican Republic: 14.70 Ecuador: 9.33 Egypt: 9.82 El Salvador: 12.43 Estonia: 18.45 Finland: 11.00 France: 17.07 Germany: 17.81 Grenada: 5.40 Guatemala: 12.95 Guyana: 8.48 Haiti: 11.32 Honduras: 14.19 Hungary: 16.14 Iceland: 11.27 India: 17.73 Indonesia: 11.87 Ireland: 19.07 Israel: 15.78 Jamaica: 14.97 Japan: 12.80 Jordan: 12.50 Kazakhstan: 7.33 Kenya: 9.10 Latvia: 17.48 Lithuania: 17.87 Malawi: 6.18 Malaysia: 18.44 Mauritius: 14.93 Mexico: 15.75 Morocco: 11.63 Netherlands: 18.11 New Zealand: 16.00 Norway: 10.80 Panama: 13.10 Peru: 8.18 Philippines: 18.07 Poland: 16.56 Portugal: 16.82 Qatar: 13.26 Romania: 16.38 Russia: 12.69 Rwanda: 7.26 Singapore: 16.69 Slovak Republic: 16.23 Slovenia: 17.15 South Africa: 13.07 South Korea: 10.64 Spain: 17.48 Sri Lanka: 15.21 St. Vincent And the Grenadines: 5.35 Sweden: 10.61 Switzerland: 13.54 Tanzania: 8.24 Thailand: 11.41 Trinidad And Tobago: 12.48 Turkey: 11.77 Ukraine: 12.59 United Arab Emirates: 15.72 United Kingdom: 18.74 United States: 19.28 Uruguay: 15.81 Vietnam: 10.41

Digital Competitiveness Index™ classification and scores are derived by assessing 70+ parameters across five key digital competitiveness enabling pillars – Digital Ecosystem (30), Human Capital (25), Financial Attractiveness (25), Enabling Environment (15) and Supporting Infrastructure (5). Each segment indicates an overall aggregate score based on a range of sub indicators with varying degree of relevance to overall digital ecosystem and competitiveness.

Data Sources – The assessment is based on data from range of sources including publicly available third party sources e.g. World Bank, IMF as well as data collected directly by Avasant Global Equations and its partners – Computer Economics and Strativa Consulting.

For More Details on Data Sources and Assessment Methodology

Financial Attractiveness

10.55 25.00 Ghana: 10.55 Argentina: 16.65 Australia: 11.42 Austria: 11.94 Bahamas: 5.74 Barbados: 7.39 Belize: 8.01 Brazil: 17.54 Bulgaria: 17.68 Canada: 12.17 Chile: 15.79 China: 17.83 Colombia: 16.68 Costa Rica: 17.21 Croatia: 16.33 Czech Republic: 15.61 Denmark: 8.71 Dominican Republic: 15.38 Ecuador: 11.97 Egypt: 13.11 El Salvador: 16.05 Estonia: 16.01 Finland: 7.64 France: 9.93 Germany: 10.55 Grenada: 1.91 Guatemala: 14.57 Guyana: 6.94 Haiti: 10.41 Honduras: 15.32 Hungary: 17.14 Iceland: 8.28 India: 18.76 Indonesia: 11.05 Ireland: 12.73 Israel: 13.39 Jamaica: 13.58 Japan: 6.21 Jordan: 14.64 Kazakhstan: 12.84 Kenya: 10.00 Latvia: 16.69 Lithuania: 17.05 Malawi: 5.54 Malaysia: 18.27 Mauritius: 14.87 Mexico: 17.41 Morocco: 13.18 Netherlands: 10.53 New Zealand: 9.60 Norway: 7.26 Panama: 14.01 Peru: 10.00 Philippines: 17.49 Poland: 16.68 Portugal: 14.22 Qatar: 11.97 Romania: 17.16 Russia: 14.04 Rwanda: 7.58 Singapore: 12.29 Slovak Republic: 15.44 Slovenia: 15.07 South Africa: 16.20 South Korea: 7.65 Spain: 11.56 Sri Lanka: 16.95 St. Vincent And the Grenadines: 1.51 Sweden: 7.34 Switzerland: 6.87 Tanzania: 7.72 Thailand: 14.57 Trinidad And Tobago: 11.06 Turkey: 13.41 Ukraine: 14.79 United Arab Emirates: 14.82 United Kingdom: 12.02 United States: 10.65 Uruguay: 14.70 Vietnam: 14.85

Digital Competitiveness Index™ classification and scores are derived by assessing 70+ parameters across five key digital competitiveness enabling pillars – Digital Ecosystem (30), Human Capital (25), Financial Attractiveness (25), Enabling Environment (15) and Supporting Infrastructure (5). Each segment indicates an overall aggregate score based on a range of sub indicators with varying degree of relevance to overall digital ecosystem and competitiveness.

Data Sources – The assessment is based on data from range of sources including publicly available third party sources e.g. World Bank, IMF as well as data collected directly by Avasant Global Equations and its partners – Computer Economics and Strativa Consulting.

For More Details on Data Sources and Assessment Methodology

Infrastructure

2.62 5.00 Ghana: 2.62 Argentina: 3.62 Australia: 4.35 Austria: 3.91 Bahamas: 0.45 Barbados: 2.92 Belize: 0.10 Brazil: 3.54 Bulgaria: 3.56 Canada: 4.54 Chile: 3.75 China: 4.17 Colombia: 3.33 Costa Rica: 3.23 Croatia: 3.64 Czech Republic: 3.89 Denmark: 4.34 Dominican Republic: 3.05 Ecuador: 2.74 Egypt: 3.31 El Salvador: 2.97 Estonia: 3.76 Finland: 4.12 France: 4.65 Germany: 4.66 Grenada: 0.30 Guatemala: 2.51 Guyana: 0.25 Haiti: 1.66 Honduras: 2.61 Hungary: 3.79 Iceland: 3.88 India: 3.41 Indonesia: 3.18 Ireland: 3.99 Israel: 3.96 Jamaica: 2.58 Japan: 4.34 Jordan: 3.08 Kazakhstan: 3.19 Kenya: 2.72 Latvia: 3.71 Lithuania: 3.66 Malawi: 3.44 Malaysia: 3.25 Mauritius: 2.87 Mexico: 3.73 Morocco: 3.07 Netherlands: 4.44 New Zealand: 3.98 Norway: 4.06 Panama: 3.21 Peru: 2.95 Philippines: 3.04 Poland: 3.74 Portugal: 4.14 Qatar: 3.60 Romania: 3.59 Russia: 3.88 Rwanda: 2.28 Singapore: 3.30 Slovak Republic: 3.52 Slovenia: 3.49 South Africa: 3.38 South Korea: 4.58 Spain: 4.37 Sri Lanka: 3.07 St. Vincent And the Grenadines: 0.10 Sweden: 4.33 Switzerland: 4.43 Tanzania: 2.65 Thailand: 3.76 Trinidad And Tobago: 2.90 Turkey: 3.76 Ukraine: 3.16 United Arab Emirates: 4.18 United Kingdom: 4.49 United States: 4.60 Uruguay: 3.57 Vietnam: 3.26

Your current subscription does not allow access to this feature. You can update your current subscription plan by selecting one of the following options or emailing us at contact@globalequations.com

Login Access

Get more information and regular updates from Global Equations

Free

Select
  • Regular Industry and Location Updates
  • Country and Sector Profile Downloads

IPA/EDA Subscription Access

Full access to all information and features through single or multiple annual subscription


Select
  • Login Access + Access to Global Equations Connect
  • Detailed Country Analysis
  • Country and Sector Analysis Insights
  • Multi-Country Comparison
  • Free Global Equations Digital Competitiveness Index (DCITM) Report Downloads
  • Single/Multiple User Access

Service Providers/MNCs/Investors Subscription Access

Full access to Global Equations for multiple users


Select
  • Login Access + Access to Global Equations Connect
  • Detailed Country Analysis
  • Country and Sector Analysis Insights
  • Multi-Country Comparison
  • Access to Real-Time Wages/Operating Cost Information (where applicable)
  • Free Global Equations Digital Competitiveness Index (DCITM) Report Downloads
  • Operational Scenario Stimulation
  • Single/Multiple User Access